Finance·Cogniphic Finance
A research team for every stock,
checked against the market.
Cogniphic Finance gives any stock to a team of AI analysts. They research it, argue both sides and decide, with entry, stop and target. Then Microsoft’s Qlib checks the call and we keep score. Every backtest is on this page.
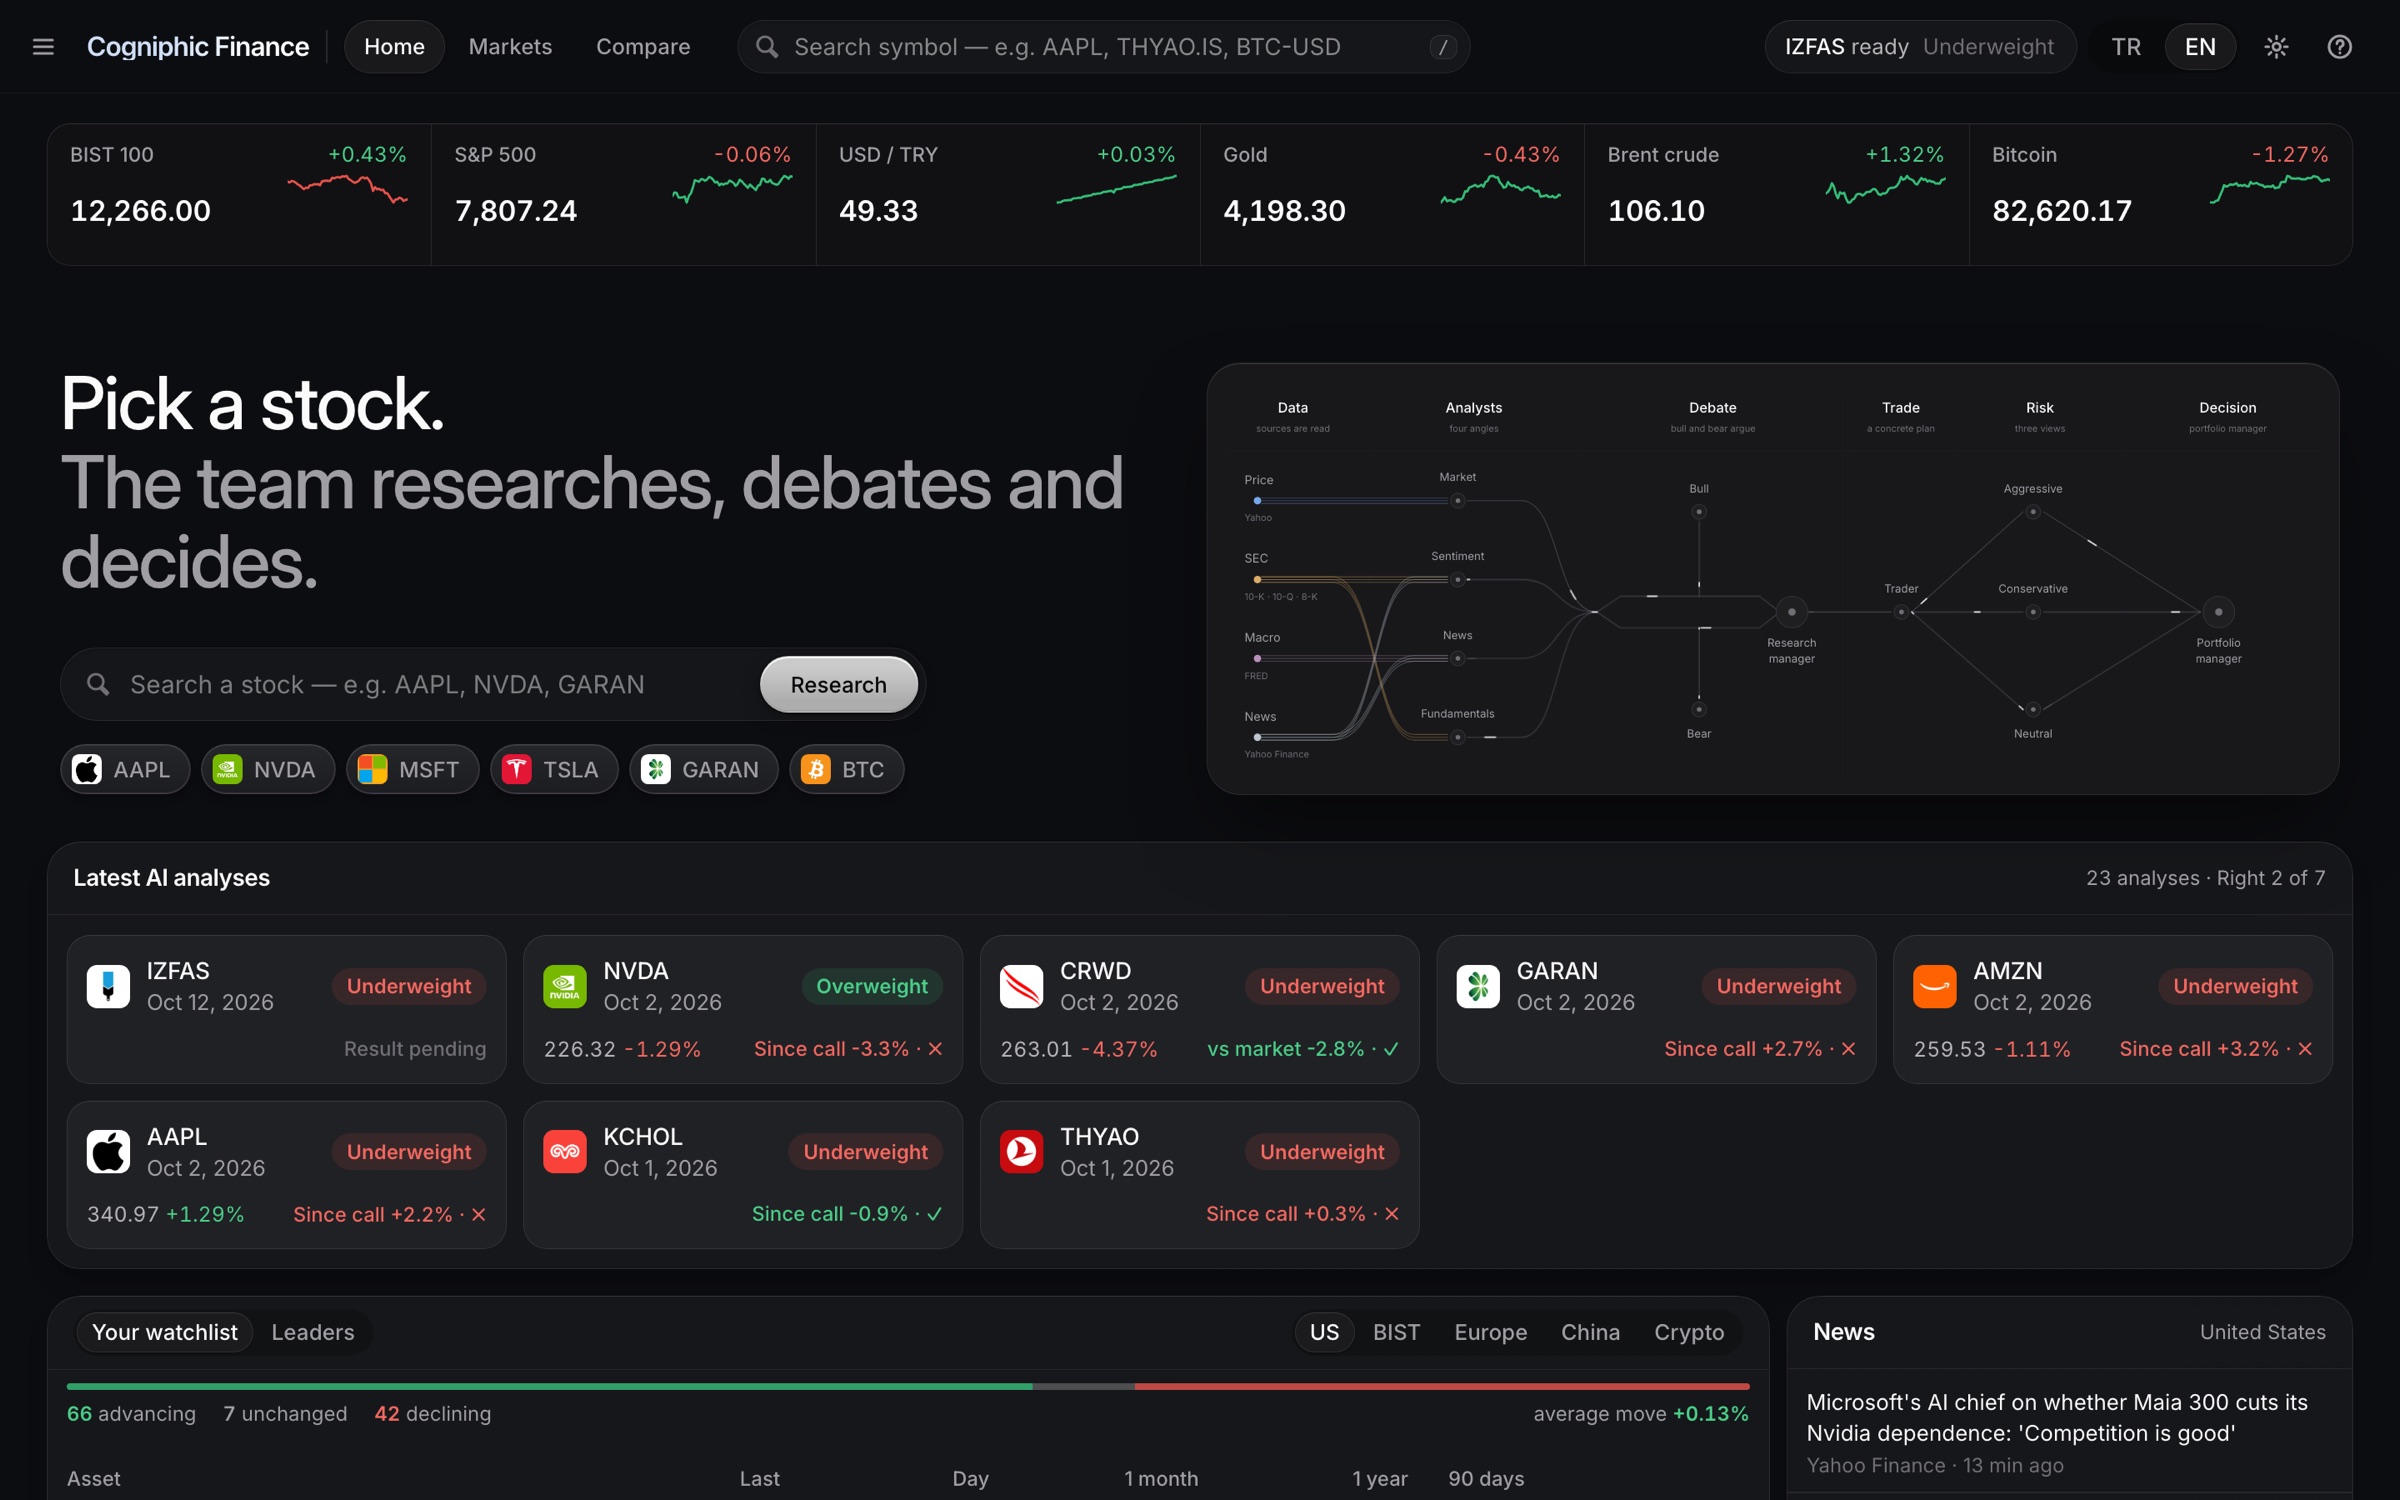
- Six-stage decision team
- Checked by Microsoft Qlib
- Every backtest published
The app
One screen per stock,
with the reasoning attached.
Search a stock in New York or Istanbul and press Analyze. A few minutes later the team’s decision is on the chart, with everything it was based on one click away.
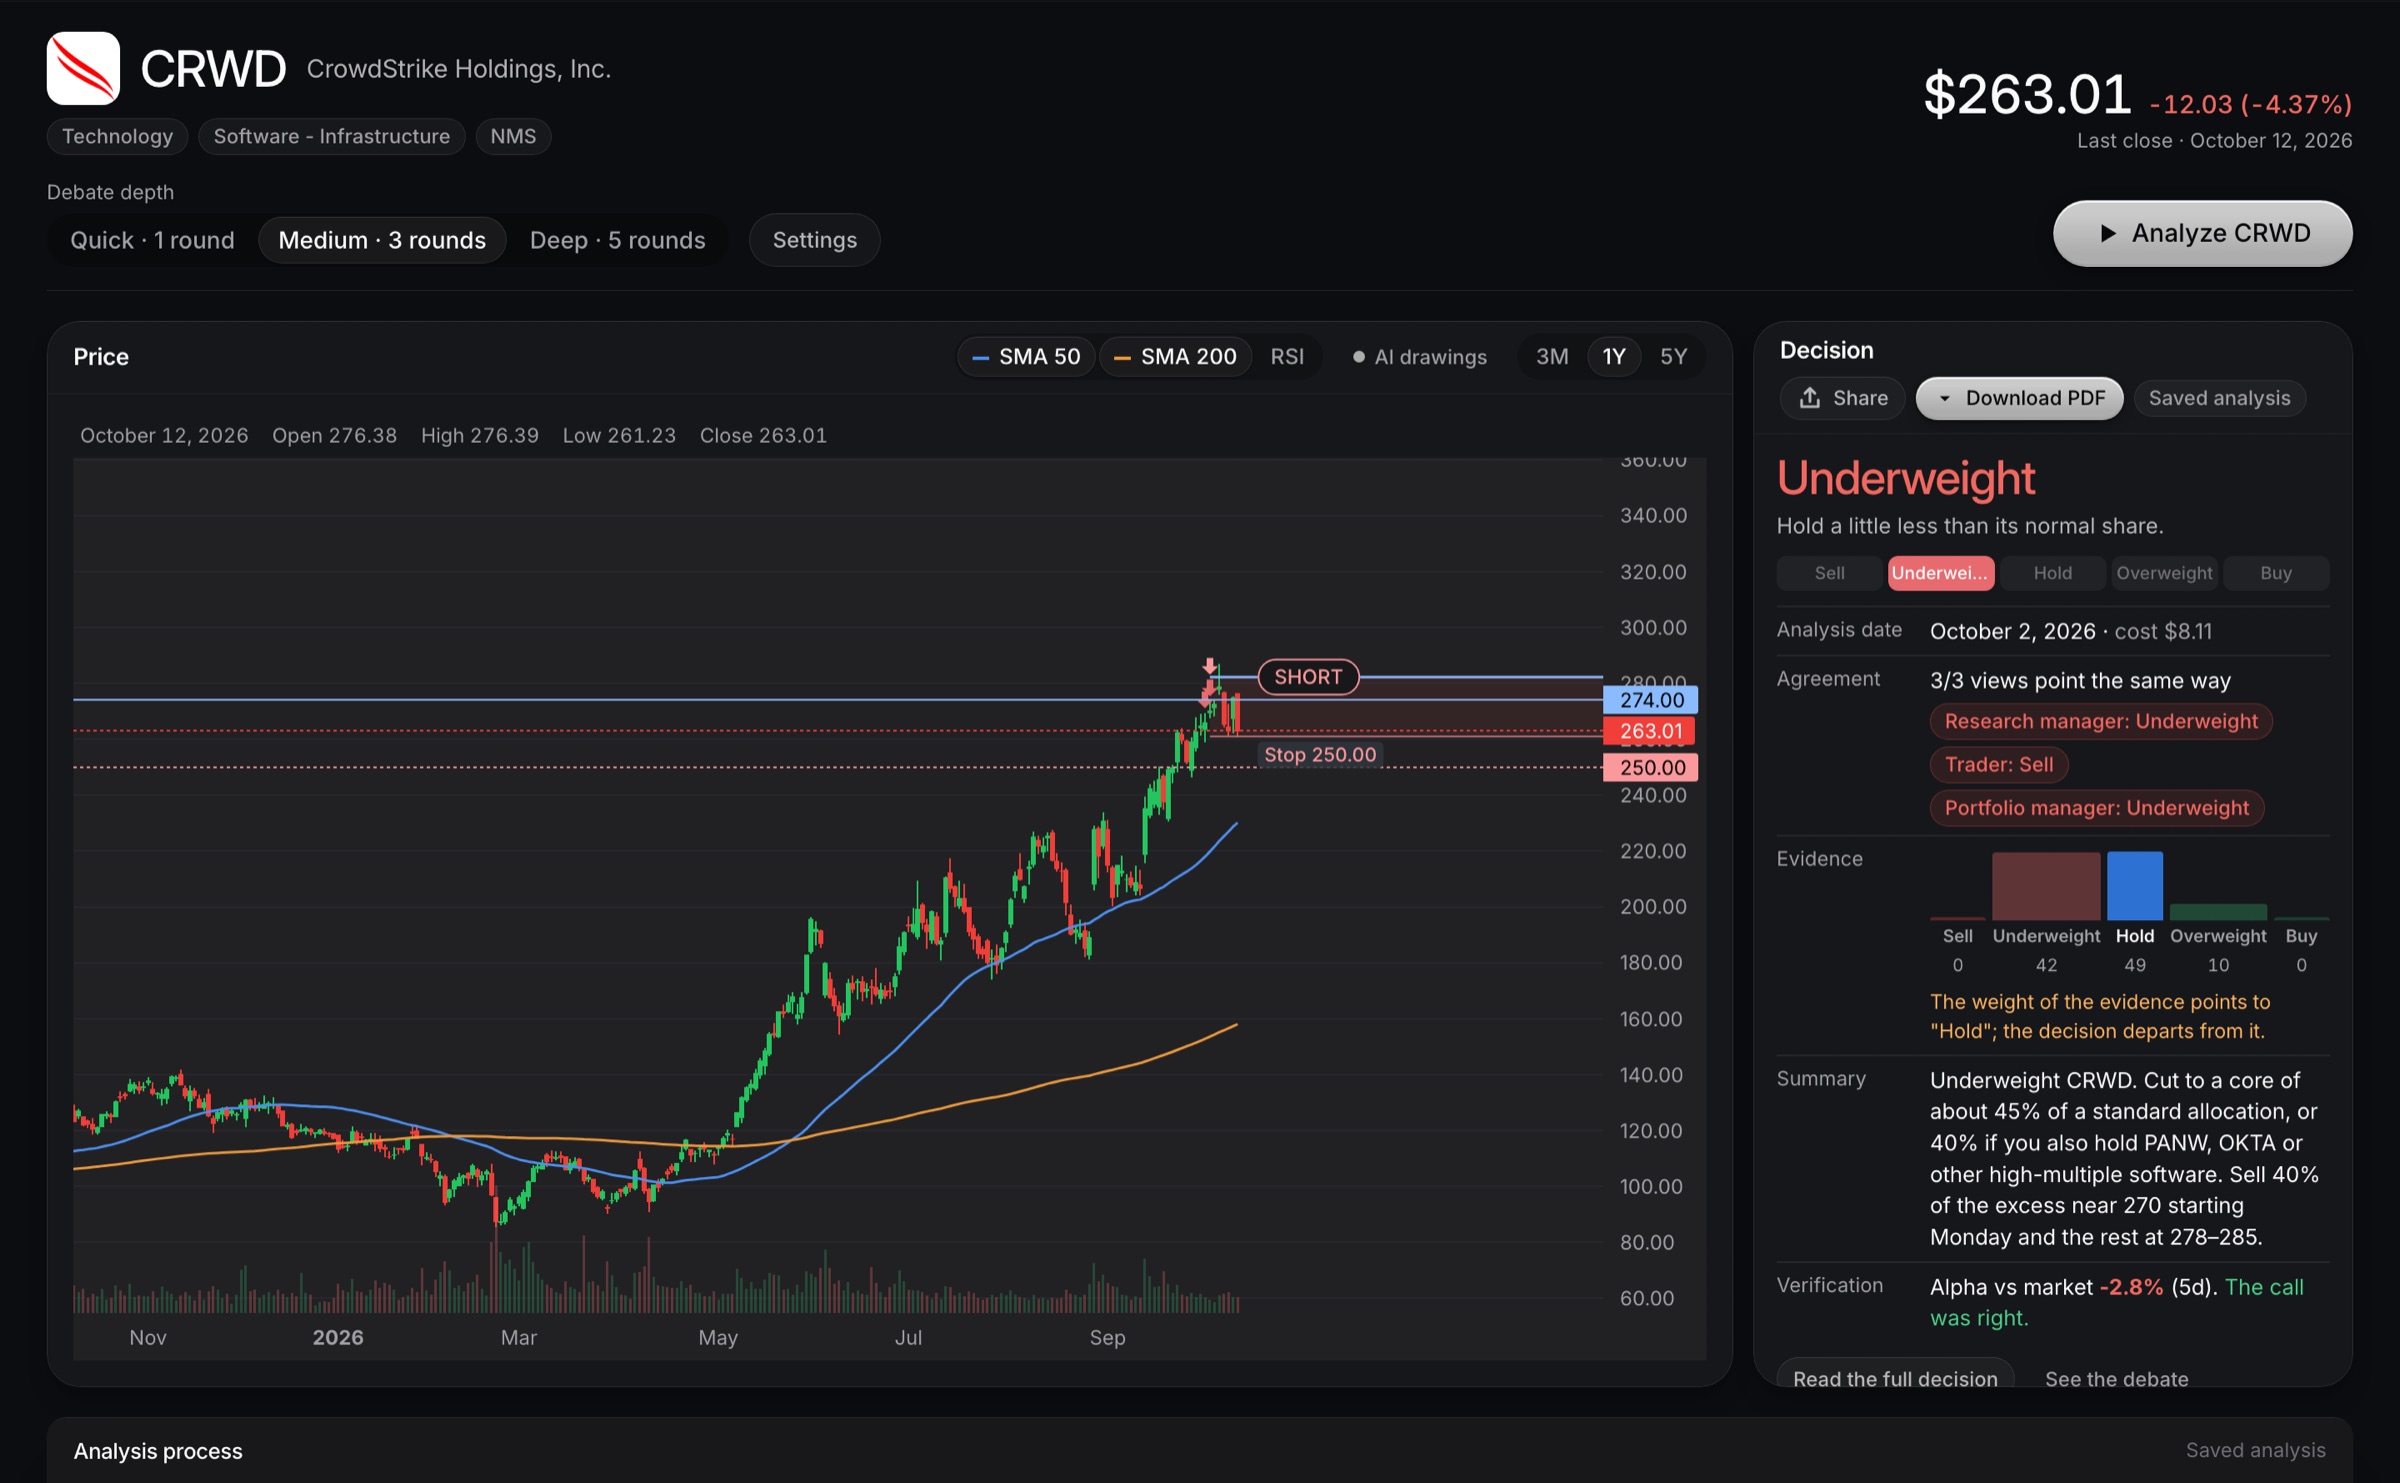
- The call, with its levels
Rating, entry, stop and target, drawn on the chart where the trade would happen.
- Who agreed
The research manager, the trader and the portfolio manager each show their own view, so a split decision is visible.
- The weight of the evidence
Every argument in the debate is counted by the rating it supports. When the call goes against the weight, the app says so.
- How it went
After five trading days the call is checked against the market and marked right or wrong, on the home screen too.
How it decides
Six stages,
two kinds of model.
Cheaper models do the reading and the arguing. Claude Opus 5.5 makes the two judgements that matter. In our runs the split cost about an eighth of an all-Opus team.
- Data
Prices, filings, macro and news, read only up to the analysis date.
No modelYahooSECFREDKAPTCMBNews - Analysts
Four analysts each write a report from their own angle.
DeepSeek V4MarketNewsFundamentalsSentiment - Debate
A bull and a bear argue over the reports for three rounds.
DeepSeek V4BullBear - Research manager
Weighs the debate, names the winner and sets the plan.
Claude Opus 5.5Judge - Trader and risk
A trader turns the plan into levels; three risk views attack it.
DeepSeek V4TraderAggressiveConservativeNeutral - Portfolio manager
Makes the call: a rating with entry, stop and target.
Claude Opus 5.5BuyOverweightHoldUnderweightSell
Microsoft’s quant platform scores every stock in the market each day from 158 price and volume features, with models retrained every quarter. The app shows where the stock ranks. In Istanbul, where the check helped in our backtests, it flags a buy call that Qlib ranks in its bottom third.
- Runs on
Your Mac: a local FastAPI server, opened inside the Cogniphic app as its own page.
- Markets
US stocks, Borsa Istanbul, Europe, China and crypto for prices; analysis for US and Istanbul stocks.
- Languages
English and Turkish, with English news for both markets.
- Data
Yahoo prices and news, SEC filings, FRED macro, KAP disclosures and the Turkish central bank for Istanbul, Finnhub and Google News.
- Keys
Model and data keys stay on the machine; nothing is proxied through us.
- Report
The full decision, the debate and every analyst’s report, as a page or a PDF.
Backtests
260 decisions,
replayed in Qlib.
We gave the team 26 stocks on ten Wednesdays after its models’ training cutoff, then traded every decision in Qlib with real costs. The question: does a book built from its calls beat simply holding the same stocks?
One unit invested, net of costs
Borsa Istanbul: 110 decisions on 11 stocks, Jul 1 to Sep 2 2026. Each decision is held for 21 trading days from the next close; Qlib rebalances the open positions daily and charges 12 bp a side.
- BIST 100 index
- Same stocks, held equally
- Agents: skip Underweight
- Agents + momentum veto
- Agents + Qlib veto
Returns are in TRY. The index line covers the same days as the books.
Data table
| Book | Return | Index | Sharpe | Max drawdown |
|---|---|---|---|---|
| Same stocks, held equally | -4.3% | -15.4% | -0.57 | -9.5% |
| Agents: skip Underweight | +2.6% | -15.4% | +0.52 | -8.0% |
| Agents: Overweight only | -3.6% | -15.4% | -0.44 | -8.2% |
| Qlib model: top half | +4.3% | -15.4% | +0.75 | -8.5% |
| Agents + Qlib veto | +4.7% | -15.4% | +0.82 | -8.1% |
| Agents + momentum veto | +9.1% | -15.4% | +1.41 | -8.0% |
What each rating was worth, 21 trading days later
Average return of the stock after each rating, with how often the call was right (Overweight up, Underweight down). Each panel is one market.
Data table
| Market | Rating | Decisions | Avg return | Avg vs index | Right |
|---|---|---|---|---|---|
| US | Overweight | 88 | +1.8% | +0.2% | 48% |
| US | Hold | 38 | +3.6% | +2.4% | — |
| US | Underweight | 24 | +1.7% | +0.3% | 38% |
| Borsa Istanbul | Overweight | 36 | +1.4% | +5.4% | 61% |
| Borsa Istanbul | Hold | 27 | +4.8% | +7.7% | — |
| Borsa Istanbul | Underweight | 47 | -2.3% | -0.6% | 74% |
Every rule against the same stocks held equally
Bars: how far each rule beat (or trailed) the equal-weight book on the test dates, August to September. Rings: the same on the July dates the rules were judged on. Holding 21 days.
- Test: Aug–Sep
- Chosen on: July
Data table
| Rule | July vs equal | Aug–Sep vs equal | Aug–Sep return | Sharpe (all) | Dates won, 21-day returns |
|---|---|---|---|---|---|
| Agents: Overweight only | -4.1 pts | +8.6 pts | +5.8% | -0.44 | 5 of 10 (t +1.1) |
| Hybrid: Overweight where Qlib agrees | +2.0 pts | +8.5 pts | +5.7% | +0.33 | 7 of 9 (t +2.0) |
| Agents + momentum veto | +8.8 pts | +8.2 pts | +5.4% | +1.41 | 9 of 9 (t +3.2) |
| Hybrid: rating × Qlib rank | +2.6 pts | +8.1 pts | +5.3% | +0.52 | 8 of 9 (t +2.3) |
| Agents: weight by rating | +0.7 pts | +8.0 pts | +5.1% | +0.21 | 9 of 10 (t +2.3) |
| Agents: skip Underweight | +3.3 pts | +7.5 pts | +4.7% | +0.52 | 10 of 10 (t +2.9) |
| Agents + Qlib veto | +4.9 pts | +7.4 pts | +4.6% | +0.82 | 9 of 9 (t +2.5) |
| Qlib model: top half | +8.0 pts | +2.7 pts | -0.1% | +0.75 | 9 of 9 (t +3.9) |
| Momentum: top half | +7.8 pts | +1.7 pts | -1.1% | +0.78 | 9 of 9 (t +3.7) |
| Same stocks, held equally | — | — | -2.8% | -0.57 | — |
The quant side
276 Qlib backtests,
and what they taught us.
Before trusting a quant score beside the agents, we tested Qlib’s own models on twelve years of prices: two markets, three scorers, two horizons, two portfolio sizes, fixed and rolling training. The learned models lost their edge within a year or two of training, and even retrained every quarter they trailed plain momentum.
Did the best validation score pick the best test result?
40 Qlib configurations: three scorers on Alpha158 features, two label horizons, two portfolio sizes, two training splits, in both markets. Each dot is one configuration's information ratio against its index, on the validation years (across) and the test years (up). Filled dots are US, rings Istanbul; dots above the dashed line did better in test than in validation.
- LightGBM
- Ridge
- 12-1 momentum (no model)
Long split: trained 2014–2021, validated 2022–2023, tested Jan 2024 to Oct 2026. Recent split: trained 2014–2024, validated 2025, tested 2026.
Data table
| Market | Split | Label | Model | Top k | Valid IR | Test IR | Test return / yr | Index / yr | Test rank IC |
|---|---|---|---|---|---|---|---|---|---|
| US | long | 21d | lgb | 10 | -0.22 | +0.17 | +22.4% | +21.0% | +0.015 |
| US | long | 21d | lgb | 20 | +0.01 | +0.64 | +28.7% | +21.0% | +0.015 |
| US | long | 21d | ridge | 10 | +0.84 | +0.49 | +29.1% | +21.0% | +0.014 |
| US | long | 21d | ridge | 20 | -0.77 | -0.42 | +15.1% | +21.0% | +0.014 |
| US | long | 21d | momentum | 10 | +0.21 | +0.15 | +21.8% | +21.0% | +0.016 |
| US | long | 21d | momentum | 20 | +0.08 | +0.73 | +32.6% | +21.0% | +0.016 |
| US | long | 5d | lgb | 10 | -0.86 | +0.27 | +24.9% | +21.0% | +0.018 |
| US | long | 5d | lgb | 20 | -0.43 | -0.02 | +20.3% | +21.0% | +0.018 |
| US | long | 5d | ridge | 10 | -1.18 | -0.39 | +13.3% | +21.0% | +0.018 |
| US | long | 5d | ridge | 20 | -0.31 | -0.23 | +17.7% | +21.0% | +0.018 |
| US | recent | 21d | lgb | 10 | +0.91 | -1.41 | -8.6% | +20.0% | -0.012 |
| US | recent | 21d | lgb | 20 | +2.35 | -1.97 | -12.4% | +20.0% | -0.012 |
| US | recent | 21d | ridge | 10 | +0.94 | -1.24 | -9.9% | +20.0% | -0.018 |
| US | recent | 21d | ridge | 20 | +0.55 | -1.38 | -1.4% | +20.0% | -0.018 |
| US | recent | 21d | momentum | 10 | -0.16 | +0.97 | +43.8% | +20.0% | +0.031 |
| US | recent | 21d | momentum | 20 | -0.50 | +0.69 | +30.3% | +20.0% | +0.031 |
| US | recent | 5d | lgb | 10 | +1.21 | -0.24 | +13.2% | +20.0% | +0.010 |
| US | recent | 5d | lgb | 20 | +1.46 | -1.22 | +0.5% | +20.0% | +0.010 |
| US | recent | 5d | ridge | 10 | +1.54 | -0.23 | +12.7% | +20.0% | +0.019 |
| US | recent | 5d | ridge | 20 | +0.52 | -2.51 | -11.2% | +20.0% | +0.019 |
| Borsa Istanbul | long | 21d | lgb | 5 | +0.23 | -0.41 | +4.9% | +18.5% | -0.006 |
| Borsa Istanbul | long | 21d | lgb | 8 | +1.46 | +0.67 | +32.0% | +18.5% | -0.006 |
| Borsa Istanbul | long | 21d | ridge | 5 | +0.45 | -0.23 | +9.3% | +18.5% | +0.038 |
| Borsa Istanbul | long | 21d | ridge | 8 | +0.19 | +0.70 | +33.9% | +18.5% | +0.038 |
| Borsa Istanbul | long | 21d | momentum | 5 | +0.25 | -0.44 | +6.8% | +18.5% | +0.086 |
| Borsa Istanbul | long | 21d | momentum | 8 | +0.81 | +1.32 | +52.6% | +18.5% | +0.086 |
| Borsa Istanbul | long | 5d | lgb | 5 | -1.33 | -0.35 | +7.5% | +18.5% | +0.003 |
| Borsa Istanbul | long | 5d | lgb | 8 | -0.34 | +0.08 | +18.3% | +18.5% | +0.003 |
| Borsa Istanbul | long | 5d | ridge | 5 | +0.29 | -0.82 | -7.8% | +18.5% | +0.007 |
| Borsa Istanbul | long | 5d | ridge | 8 | -0.26 | -1.06 | -2.5% | +18.5% | +0.007 |
| Borsa Istanbul | recent | 21d | lgb | 5 | -1.87 | -1.04 | -13.4% | +11.2% | -0.070 |
| Borsa Istanbul | recent | 21d | lgb | 8 | -1.31 | -0.93 | -11.3% | +11.2% | -0.070 |
| Borsa Istanbul | recent | 21d | ridge | 5 | +0.96 | -1.12 | -17.1% | +11.2% | +0.035 |
| Borsa Istanbul | recent | 21d | ridge | 8 | +1.35 | -0.34 | +2.4% | +11.2% | +0.035 |
| Borsa Istanbul | recent | 21d | momentum | 5 | -2.05 | +0.05 | +9.3% | +11.2% | +0.114 |
| Borsa Istanbul | recent | 21d | momentum | 8 | +0.34 | +0.17 | +10.9% | +11.2% | +0.114 |
| Borsa Istanbul | recent | 5d | lgb | 5 | -0.24 | -2.48 | -37.0% | +11.2% | +0.005 |
| Borsa Istanbul | recent | 5d | lgb | 8 | -1.80 | -0.73 | -2.7% | +11.2% | +0.005 |
| Borsa Istanbul | recent | 5d | ridge | 5 | +1.16 | +0.18 | +12.9% | +11.2% | -0.008 |
| Borsa Istanbul | recent | 5d | ridge | 8 | +0.60 | -0.71 | -5.2% | +11.2% | -0.008 |
Retrained every quarter, January 2024 to October 2026
US: each quarter the models learn from the eight years before it and score only that quarter. Top 20 stocks held, 5 bp a side, in USD.
- S&P 500 (SPY)
- 12-1 momentum
- LightGBM, retrained quarterly
- Ensemble (LightGBM + Ridge + momentum)
Data table
| Scorer | Top k | Return / yr | Index / yr | Sharpe | Info ratio | Max drawdown | Rank IC |
|---|---|---|---|---|---|---|---|
| rolling lgb | 10 | +14.1% | +21.0% | +0.73 | -0.34 | -19.5% | +0.026 |
| rolling lgb | 20 | +17.0% | +21.0% | +1.05 | -0.33 | -16.0% | +0.026 |
| rolling ridge | 10 | +16.9% | +21.0% | +0.81 | -0.14 | -18.7% | +0.011 |
| rolling ridge | 20 | +11.4% | +21.0% | +0.72 | -0.80 | -18.2% | +0.011 |
| rolling momentum | 10 | +21.8% | +21.0% | +0.93 | +0.15 | -22.4% | +0.016 |
| rolling momentum | 20 | +32.6% | +21.0% | +1.40 | +0.73 | -17.0% | +0.016 |
| rolling ensemble | 10 | +12.0% | +21.0% | +0.62 | -0.45 | -23.2% | +0.030 |
| rolling ensemble | 20 | +10.6% | +21.0% | +0.65 | -0.99 | -23.9% | +0.030 |
Findings
What the numbers say,
and what we changed.
Four results from 260 decisions. Two are good news, one is not, and each changed the product.
- In Istanbul, the calls carried real information.
Stocks rated Underweight went on to return −2.3% over 21 days and Overweights +1.4%. Dropping the Underweights beat holding the same stocks on 10 of 10 dates.
+3.8 ptsOverweight minus Underweight, 90% interval +0.9 to +6.7 - In the US, not yet.
Overweights returned +1.8% and Underweights +1.7%, and the rule won on 4 of 10 dates. A quarter is short, but this is a no, and the US research team is the next thing we work on.
+0.1 ptsOverweight minus Underweight, US - Qlib is a good second opinion in Istanbul.
Letting Qlib veto the bottom third of the agents’ buys widened their lead there, and a plain momentum veto widened it most. In the US, price signals reversed this quarter (momentum lost on 9 of 10 dates), so there the app shows Qlib’s rank as context only.
+7.0 → +9.1 → +13.4 ptsIstanbul vs same stocks: agents, + Qlib veto, + momentum veto - Holding past two weeks added nothing.
Books that held each call for 10 days did at least as well as books that held for 21, in both markets. The app now marks a decision as stale after ten trading days and asks for a fresh one.
+9.6 vs +7.0 ptsIstanbul, agents vs same stocks, 10-day vs 21-day holds
Method
Written down first,
then run.
The rules for judging were fixed before the results were in. Every number on this page comes from the saved runs.
- Engine
Microsoft Qlib 0.9.7: its data format, its Alpha158 features, its models, and its backtest executor and exchange for every number on this page.
- Prices
Daily, split- and dividend-adjusted, January 2014 to October 2026, written to Qlib’s binary format. 98 US large caps and 30 Istanbul large caps.
- Agents
The live setup: DeepSeek V4 for the analysts, debate, trader and risk team; Claude Opus 5.5 for the research and portfolio managers; three debate rounds. The sentiment analyst was left out: its social feeds keep no history.
- Dates
Ten Wednesdays, 1 July to 2 September 2026, after the models’ training cutoff. Every data source serves only what was published by the analysis date.
- Trading
A decision trades at the next close. Positions are rebalanced daily by Qlib, with 5 bp a side in the US and 12 bp in Istanbul, where the ±10% price limit also applies.
- Fixed in advance
Rules were judged on the July dates only; August and September were kept back to test them. The Qlib model used beside the agents was chosen before any agent result was seen.
- Spend
About $0.90 per agent decision in model costs. Qlib runs on the Mac at no cost.
Limits
What this
does not show.
These are the edges of what we measured.
- Three months
The agent decisions cover one quarter. A quarter can flatter or punish any rule; these results are a first reading, not a track record.
- Few stocks a day
The agents look at a few dozen stocks, not a whole market, so a book built from them is concentrated.
- Survivorship
Qlib’s universes are today’s large caps. Over the long 2014–2026 history that favours the stocks that survived.
- Not advice
Nothing here is investment advice. The app is a research tool; its calls can be wrong, as the charts show.
- Model drift
The learned Qlib models lost their edge within a year or two of training. Retraining every quarter is part of the answer, not all of it.
- One currency each
US results are in dollars and Istanbul results in lira, against each market’s own index, without converting one into the other.